
In the Markets Now: Bull Market Biopsy
Are we getting close to the end of this bull market?
With U.S. stocks near all time highs, it’s natural for investors to ask a familiar question: are we getting close to the end of this bull market?
Negative headlines remain plentiful (when don’t they?), but markets continue to display a resilience and momentum that would imply plenty of gas left in the tank. So, as we ride through year four of this bull market – and with some obvious signs of speculative excess – it seems as good a time as any to turn a more methodical eye towards its future.
Let’s start with the easily measurable categories: length and magnitude. Looking at the 12 major bull runs in the post-WWII era, the average length was over 60 months, with an average return of 177%. Today’s bull market is 43 months old and has delivered a return of ~106%. Just considering these numbers, there’s little to suggest the rally is particularly long in the tooth. But of course, the average length and return are far from guaranteed – among the sample are bull markets as long as 13 years and as short as 20 months. So, where might we head from here to break things down a bit further?
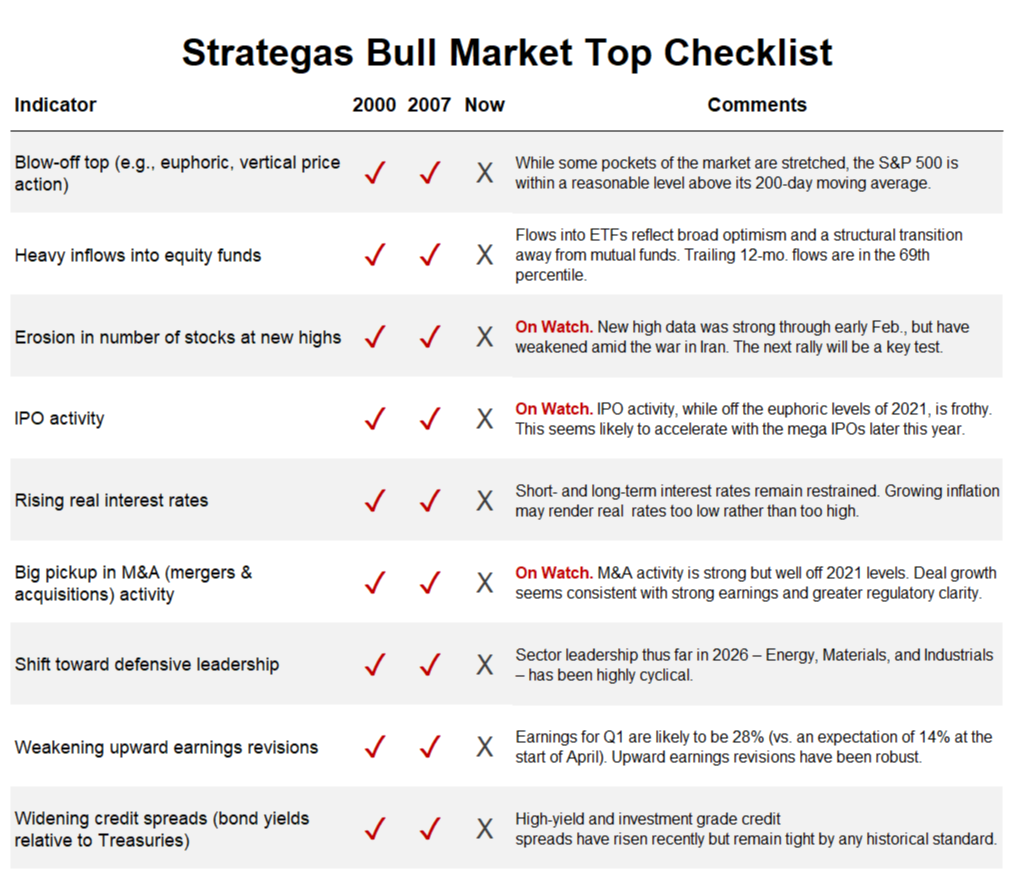
Every cycle is different – from the drivers of growth to the economic backdrop – but if history doesn’t always repeat, it does often rhyme. To identify areas where we might look for rhymes, our partners at Strategas maintain a checklist of commonalities seen at major market peaks across history. Bull markets don’t usually end quietly and they don’t usually end because investors are nervous. More often, they end after excesses have built up across multiple fronts (e.g., valuation, speculation, credit, sentiment, etc.). This checklist is an unemotional way to quantify those items and compare today’s market with those of recent history.
The punchline first: there is little to suggest a top is imminent. While sentiment is getting frothy in spots (which will make this year’s mega tech IPOs particularly important to watch), the earnings and credit backdrop look healthy. And that might actually be underselling it. With the first quarter earnings season all but over, profits are tracking to be up ~28% year-over-year, the biggest jump since the post-pandemic rebound in 2021. Perhaps even more striking, the S&P 500’s profit margin is tracking at ~15%, which would be the best margin since at least 2009. Strong fundamentals don’t render the market immune to selloffs, nor is that strength guaranteed to last. But neither bear markets nor recessions have tended to happen when profitability is as robust as it is today.
Ultimately, there is value in vigilance – markets don’t go up and to the right forever, and risk management is a big part of the wealth management experience. But history’s lesson is clear: bull markets climb the wall of worry (often for further and longer than most imagine is possible) and for most investors, the biggest risk is being left behind.
Disclosures
This is not a complete analysis of every material fact regarding any company, industry or security. The opinions expressed here reflect our judgment at this date and are subject to change. The information has been obtained from sources we consider to be reliable, but we cannot guarantee the accuracy. Market and economic statistics, unless otherwise cited, are from data provider FactSet.
This report does not provide recipients with information or advice that is sufficient on which to base an investment decision. This report does not take into account the specific investment objectives, financial situation, or need of any particular client and may not be suitable for all types of investors. Recipients should not consider the contents of this report as a single factor in making an investment decision. Additional fundamental and other analyses would be required to make an investment decision about any individual security identified in this report.
For investment advice specific to your situation, or for additional information, please contact your Baird Financial Advisor and/or your tax or legal advisor.
Past performance is not indicative of future results and diversification does not ensure a profit or protect against loss. All investments carry some level of risk, including loss of principal. An investment cannot be made directly in an index.
Copyright 2026 Robert W. Baird & Co. Incorporated.
Other Disclosures
UK disclosure requirements for the purpose of distributing this research into the UK and other countries for which Robert W. Baird Limited holds an ISD passport.
This report is for distribution into the United Kingdom only to persons who fall within Article 19 or Article 49(2) of the Financial Services and Markets Act 2000 (financial promotion) order 2001 being persons who are investment professionals and may not be distributed to private clients. Issued in the United Kingdom by Robert W. Baird Limited, which has an office at Finsbury Circus House, 15 Finsbury Circus, London EC2M 7EB, and is a company authorized and regulated by the Financial Conduct Authority. For the purposes of the Financial Conduct Authority requirements, this investment research report is classified as objective.
Robert W. Baird Limited ("RWBL") is exempt from the requirement to hold an Australian financial services license. RWBL is regulated by the Financial Conduct Authority ("FCA") under UK laws and those laws may differ from Australian laws. This document has been prepared in accordance with FCA requirements and not Australian laws.


